
Martin
Founder, strategy and audits
Writes every audit and takes every first call. On your account from day one, running growth for SMEs since 2010.
Few homeowners go looking for crawl space work until a smell, a soft floor or a failed inspection report forces the issue. Analytics shows which searches, ads and referral partners bring those people to a free inspection and on to a signed project, and which bring only worried browsing.
For crawl space encapsulation owners who want inspections, proposals and signed projects traced to searches, ads and agent or inspector referrals each month.
Context from how your customers search, compare and book.
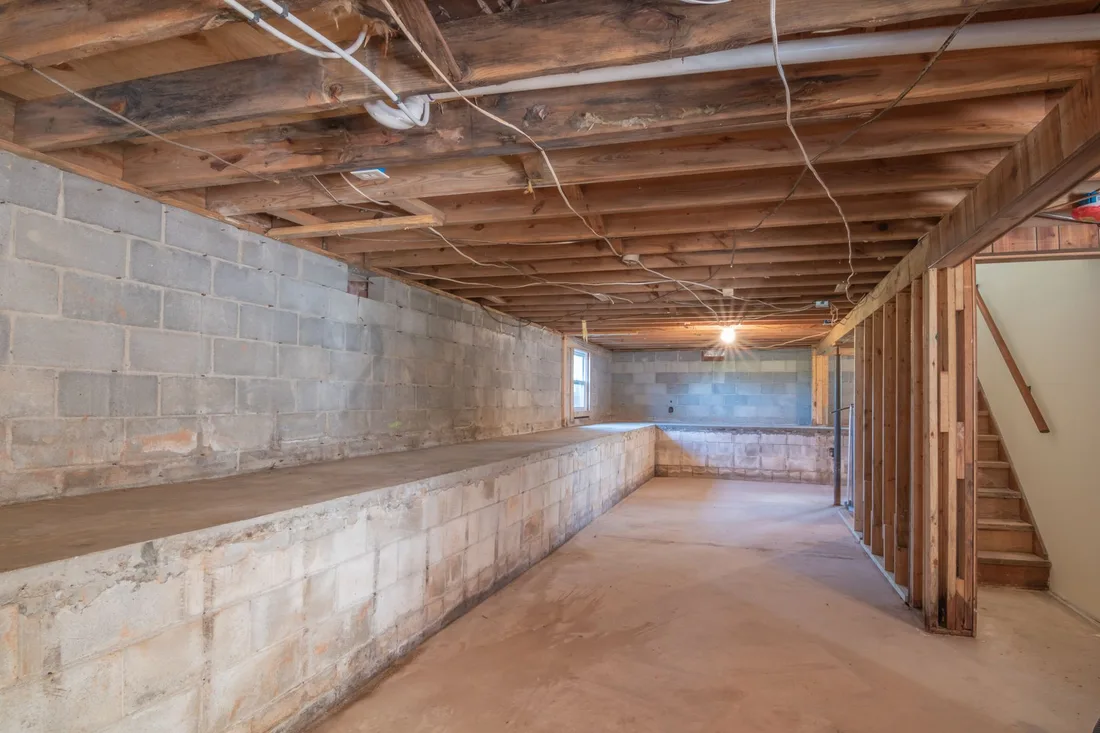
Crawl space leads begin with a symptom. A damp musty smell upstairs, cold floors in winter, a sagging section, a high humidity reading, standing water after rain or a line in a home inspector's report. Reports must record the symptom, because a smell and a failed inspection behave very differently.
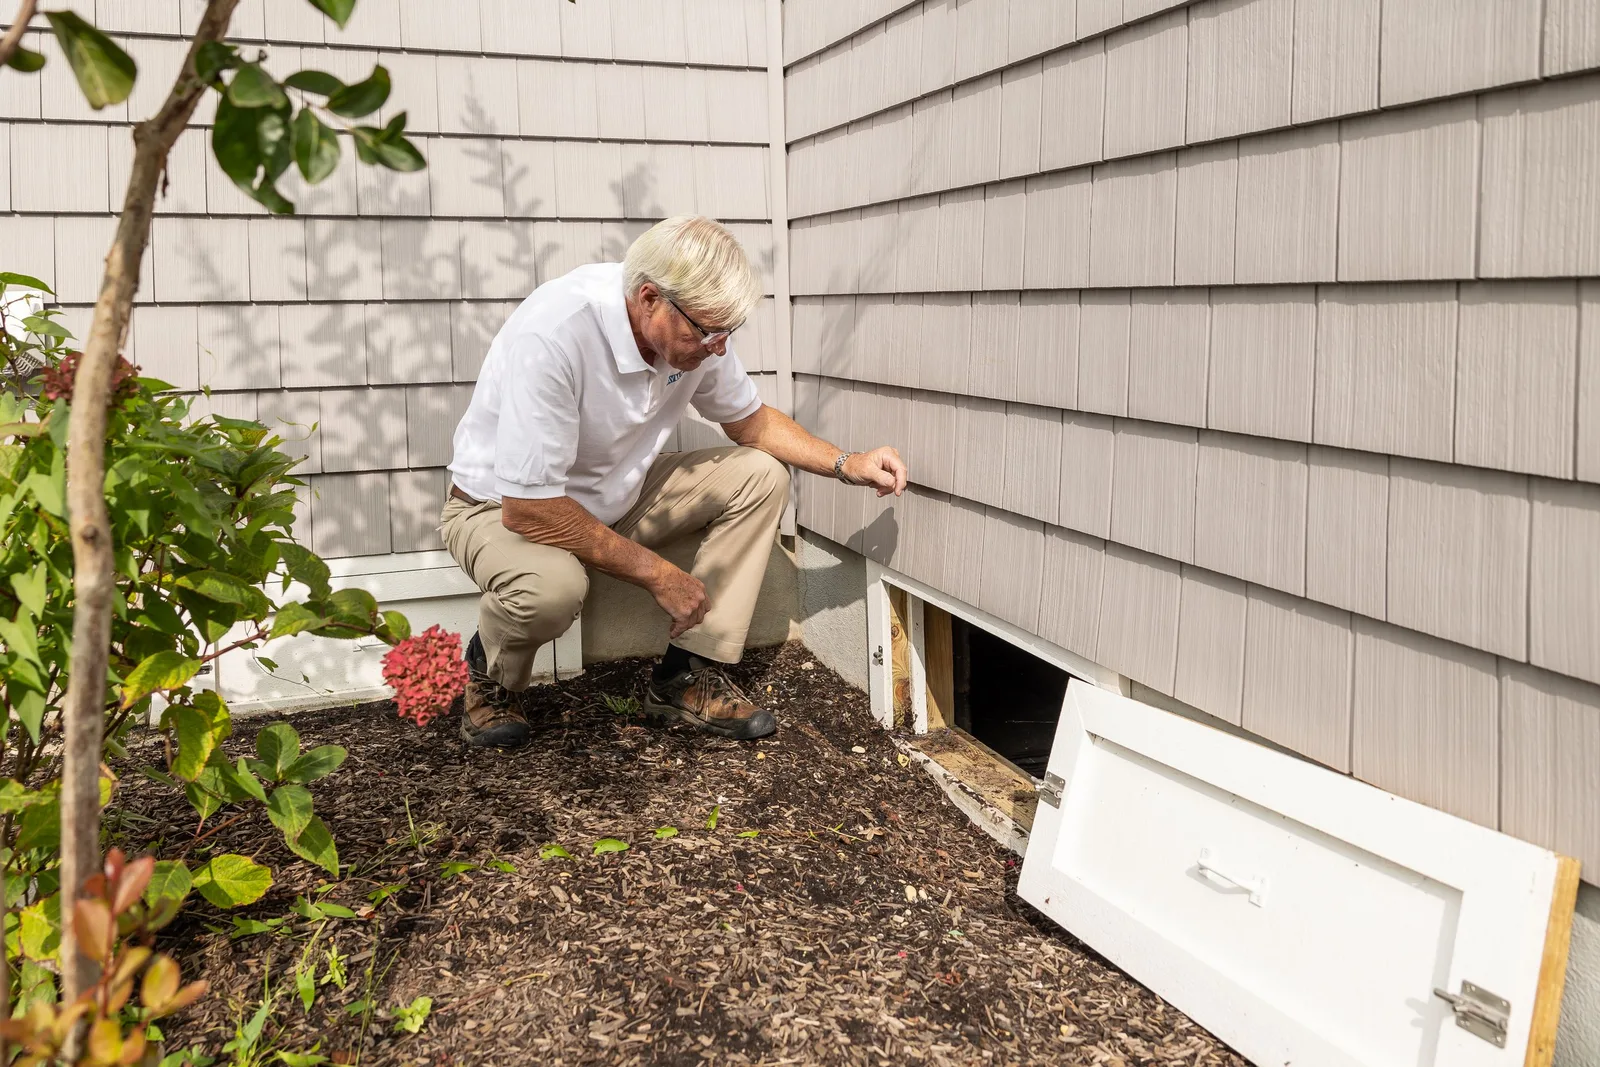
A sale has more steps than most homeowners expect. A free inspection is booked, the crew crawls under the house, photos and moisture readings are taken, a proposal offers options and the owner thinks it over. Each step can stall. We follow one record through all of them, so you see where people drop out.
Sellers and agents create urgency that homeowners do not. A buyer's inspection flags moisture and the sale needs a fix before closing. These leads move quickly and are valuable, but they are rare and hard to trace. We label them, so one busy week of sale-driven jobs is not mistaken for a steady flow.
Referrals carry more weight than they appear to. Home inspectors, agents, plumbers and landlords may send many jobs, often by phone or text with no click at all. We give key partners their own tracking number or link and keep an honest unknown line for the rest, so paid channels are not credited with their work.
A clear, repeatable process built around how crawl space encapsulation customers search and decide.

We agree the stages: request, inspection booked, inspection done, proposal sent, signed and installed, with a plan sold at the end. Symptom and trigger labels such as smell, water, failed inspection and energy bills are added.

Numbers and form tags go on the website, ads, guides and map listing. The request form asks about the symptom, access, home age and any standing water, with a photo upload, so each lead arrives with detail rather than a bare number.

Your office marks each lead as inspected, proposed, signed or lost. We match that to the source, the project type and a job size band, so reports count projects that were sold rather than calls that faded.

Each month you see cost per inspection and cost per signed project by source, split by full encapsulation, dehumidifier only, drainage and repair work. Seasonal moisture peaks are marked beside the numbers, with a note on what we would try next.

We study inspections that did not turn into proposals and proposals that did not sign. Sometimes the cause is price, sometimes a slow proposal, sometimes a worried owner who needed a second explanation. The report helps tell which.
See which channels bring real inquiries and new customers
The mechanics behind Analytics for crawl space encapsulation, explained plainly.
Key partners get a personal number or booking link. Calls and requests through it appear as a named line, so you can see how much a good inspector sends compared with a paid search campaign.
Moisture readings, photos and notes from the crawl are stored on the record. They support the proposal and also show later whether conditions improved. No personal data beyond what you already hold is added.
Moisture work follows wet spells and humid months. We mark the weather periods on the timeline, so a spike after heavy rain is read for what it is, and a quiet dry month is not blamed on the campaign.
Crawl Space Encapsulation analytics setup starts at $500 USD one-time. Ongoing monthly reporting and reviews are scoped separately.
What's included
A short plan naming the calls, forms and bookings that count as a real lead or sale for your business.
Tracking set up and tested so each lead is tied to the search or ad behind it.
A simple report layout and a walkthrough so your team can read it without help.
Monthly reviews, extra dashboards and data clean-up are scoped separately. Talk to us for a fit.
With a sale this staged, early reports show inspections first, and signed projects gather over the following months.
We audit the forms, numbers and guides, add tracking and run test requests with photos. You agree the stages and trigger labels, and your office learns the short routine for marking each lead as inspected, proposed, signed or lost.
The first reports show inspections and proposals by source. Signed projects begin to link back as proposals close. You may see that search brings worried homeowners and partners bring sale deadlines, which are separate lines in the report.
With a few months of closed projects you can compare sources by cost per signed project and project type. A year shows seasonal moisture patterns. Results depend on weather, price and competition, and we promise no set number of jobs.
Our team
Martin writes every audit and takes the first call. The same team stays on the account. 160+ businesses since 2010.
Founder, strategy and audits
Writes every audit and takes every first call. On your account from day one, running growth for SMEs since 2010.

Social and app development
Shapes social strategy and builds practical app experiences that turn attention into action.

SEO
Owns technical, local and content SEO so the right buyers find you when demand is highest.

Paid media
Plans and manages paid search and social campaigns around qualified leads.

Analytics
Connects tracking, attribution and reporting so decisions are based on revenue-quality data.

Design
Creates clear brand and conversion-focused design across landing pages, campaigns and product experiences.
Certified and experienced
Verified platform knowledge, 25+ years of hands-on experience, and an operating track record since 2010.
Get a free audit and we will show you where you are losing inquiries today.
Get a Free Audit arrow_forward